send link to app
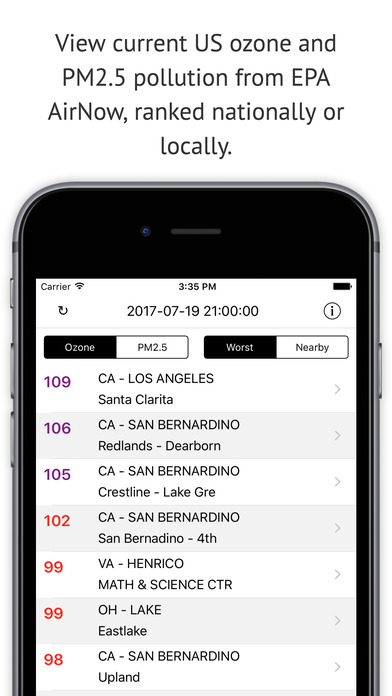
Browse current US air pollution data from the EPA AirNow sensors.
Filter sensors within 125 miles with the "Nearby" feature.
Ozone and PM2.5 is tracked.
Sensor data is ranked from worst air quality to best, either nationally or locally with the "Nearby" tab.
View each sensors location on a map.
View a summary map with all the sensors on one map.
Ozone data is in ppb [parts per billion].
PM2.5 data is in μg / m^3 [micrograms per cubic meter].
Data is categorized into Hazardous, Very Unhealthy, Unhealthy, Unhealthy for Sensitive Groups, Moderate, and Good.
Data timestamp is in UTC.
Note: Data for Canada and Mexico is not in this app.


